
2002 MCM Problem:If we SCRUB our land too much, we may lose the LIZARDs
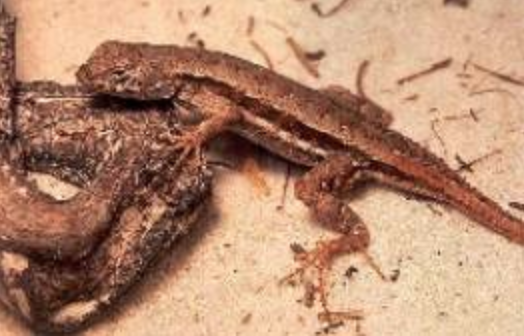 Picture by Grant Hokit
The Florida scrub lizard is a small, gray or gray-brown lizard that lives throughout upland sandy areas in the Central and Atlantic coast regions of Florida. The Florida Committee on Rare and Endangered Plants classified the scrub lizard as endangered.
You will find a fact sheet on the Florida Scrub Lizard at scrublizard.pdf
The long-term survival of the Florida scrub lizard is dependent upon preservation of the proper spatial configuration and size of scrub habitat patches.
Task 1: Discuss factors that may contribute to the loss of appropriate habitat for scrub lizards in Florida. What recommendations would you make to the state of Florida to preserve these habitats and discuss obstacles to the implementation of your recommendations?
Task 2: Utilize the data provided in Table 1 to estimate the value for $F_a$(the average fecundity of adult lizards); $S_j$(the survivorship of juvenile lizards- between birth and the first reproductive season); and $S_a$ (the average adult survivorship).
Table 1
Summary data for a cohort of scrub lizards captured and followed for 4 consecutive years. Hatchling lizards (age 0) do not produce eggs during the summer they are born. Average clutch size for all other females is proportional to body size according to the function $y = 0.21*(SVL)-7.5$, where y is the clutch size and $SVL$ is the snout-to-vent length in mm.
|
Year |
Age |
Total Number Living |
Number of Living Females |
Avg. Female Size (mm) |
|
1 |
0 |
972 |
495 |
30.3 |
|
2 |
1 |
180 |
92 |
45.8 |
|
3 |
2 |
20 |
11 |
55.8 |
|
4 |
3 |
2 |
2 |
56.0 |
Task 3: It has been conjectured that the parameters $F_a$ , $S_j$ , and Sa , are related to the size and amount of open sandy area of a scrub patch. Utilize the data provided in Table 2 to develop functions that estimate $F_a$, $S_j$ , and $S_a$ for different patches. In addition, develop a function that estimates C, the carrying capacity of scrub lizards for a given patch.
Table 2
Summary data for 8 scrub patches including vital rate data for scrub lizards. Annual female fecundity ($F_a$), juvenile survivorship (Sj), and adult survivorship (Sa) are presented for each patch along with patch size and the amount of open sandy habitat.
|
Patch |
Patch Size (ha) |
Sandy Habitat (ha) |
$F_a$ |
$S_j$ |
$S_a$ |
Density (lizards/ha) |
|
a |
11.31 |
4.80 |
5.6 |
0.12 |
0.06 |
58 |
|
b |
35.54 |
11.31 |
6.6 |
0.16 |
0.10 |
60 |
|
c |
141.76 |
51.55 |
9.5 |
0.17 |
0.13 |
75 |
|
d |
14.65 |
7.55 |
4.8 |
0.15 |
0.09 |
55 |
|
e |
63.24 |
20.12 |
9.7 |
0.17 |
0.11 |
80 |
|
f |
132.35 |
54.14 |
9.9 |
0.18 |
0.14 |
82 |
|
g |
8.46 |
1.67 |
5.5 |
0.11 |
0.05 |
40 |
|
h |
278.26 |
84.32 |
11.0 |
0.19 |
0.15 |
115 |
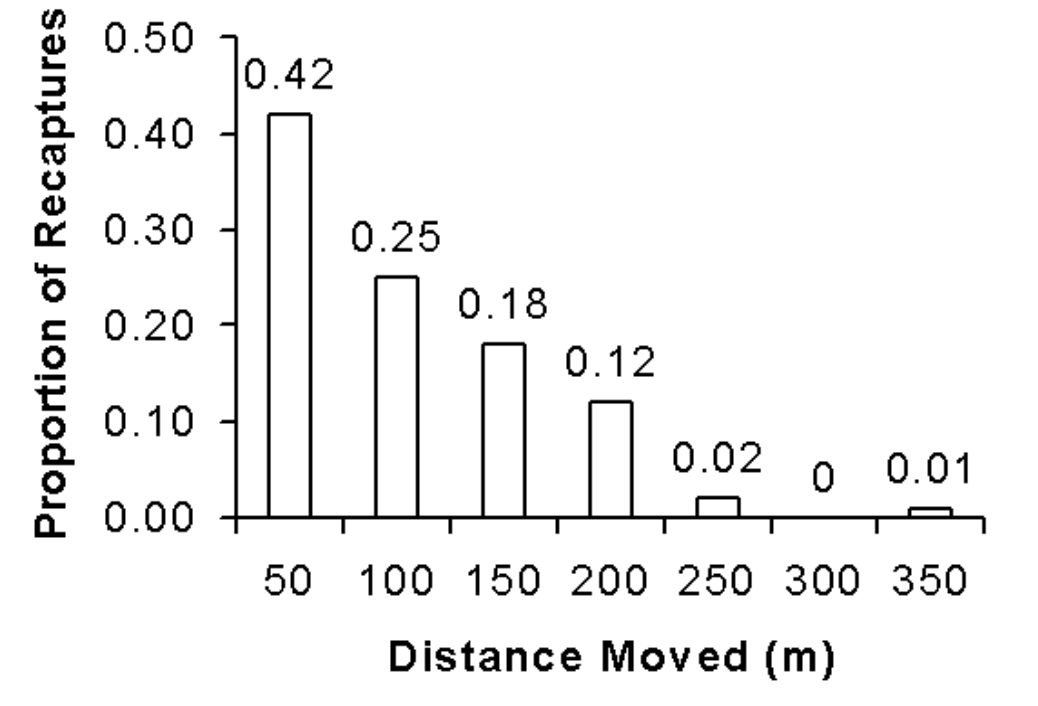
Task 4: There are many animal studies that indicate that food, space, shelter, or even reproductive partners may be limited within a habitat patch causing individuals to migrate between patches. There is no conclusive evidence on why scrub lizards migrate. However, about 10 percent of juvenile lizards do migrate between patches and this immigration can influence the size of the population within a patch. Adult lizards apparently do not migrate. Utilizing the data provided in the histogram below estimate the probability of lizards surviving the migration between any two patches $i$ and patch $j$.
Table 3
Histogram
Migration data for juvenile lizards marked, released, and recaptured up to 6 months later. Surveys for recapture were conducted up to 750m from release sites.
Task 5: Develop a model to estimate the overall population size of scrub lizards for the landscape given in Table 3. Also, determine which patches are suitable for occupation by scrub lizards and which patches would not support a viable population.
Patch size and amount of open sandy habitat for a landscape of 29 patches located on the Avon Park Air Force Range. See:
for a map of the landscape.
|
Patch Identification |
Patch Size (ha) |
Sandy Habitat (ha) |
|
1 |
13.66 |
5.38 |
|
2 |
32.74 |
11.91 |
|
3 |
1.39 |
0.23 |
|
4 |
2.28 |
0.76 |
|
5 |
7.03 |
3.62 |
|
6 |
14.47 |
4.38 |
|
7 |
2.52 |
1.99 |
|
8 |
5.87 |
2.49 |
|
9 |
22.27 |
8.44 |
|
10 |
19.25 |
7.58 |
|
11 |
11.31 |
4.80 |
|
12 |
74.35 |
19.15 |
|
13 |
21.57 |
7.52 |
|
14 |
15.50 |
2.82 |
|
15 |
35.54 |
11.31 |
|
16 |
2.93 |
1.15 |
|
17 |
47.21 |
10.73 |
|
18 |
1.67 |
0.13 |
|
19 |
9.80 |
2.23 |
|
20 |
39.31 |
7.15 |
|
21 |
2.23 |
0.78 |
|
22 |
3.73 |
1.02 |
|
23 |
8.46 |
1.67 |
|
24 |
3.89 |
1.89 |
|
25 |
1.33 |
1.11 |
|
26 |
0.85 |
0.79 |
|
27 |
8.75 |
5.30 |
|
28 |
9.77 |
6.22 |
|
29 |
13.45 |
4.69 |
TASK 6: It has been determined from aerial photographs that vegetation density increases by about 6% a year within the Florida scrub areas. Please make a recommendation on a policy for controlled burning.