2017 MCM C:“Cooperate and navigate”
Traffic capacity is limited in many regions of the United States due to the number of lanes of roads. For example, in the Greater Seattle area drivers experience long delays during peak traffic hours because the volume of traffic exceeds the designed capacity of the road networks. This is particularly pronounced on Interstates 5, 90, and 405, as well as State Route 520, the roads of particular interest for this problem.
Self-driving, cooperating cars have been proposed as a solution to increase capacity of highways without increasing number of lanes or roads. The behavior of these cars interacting with the existing traffic flow and each other is not well understood at this point.
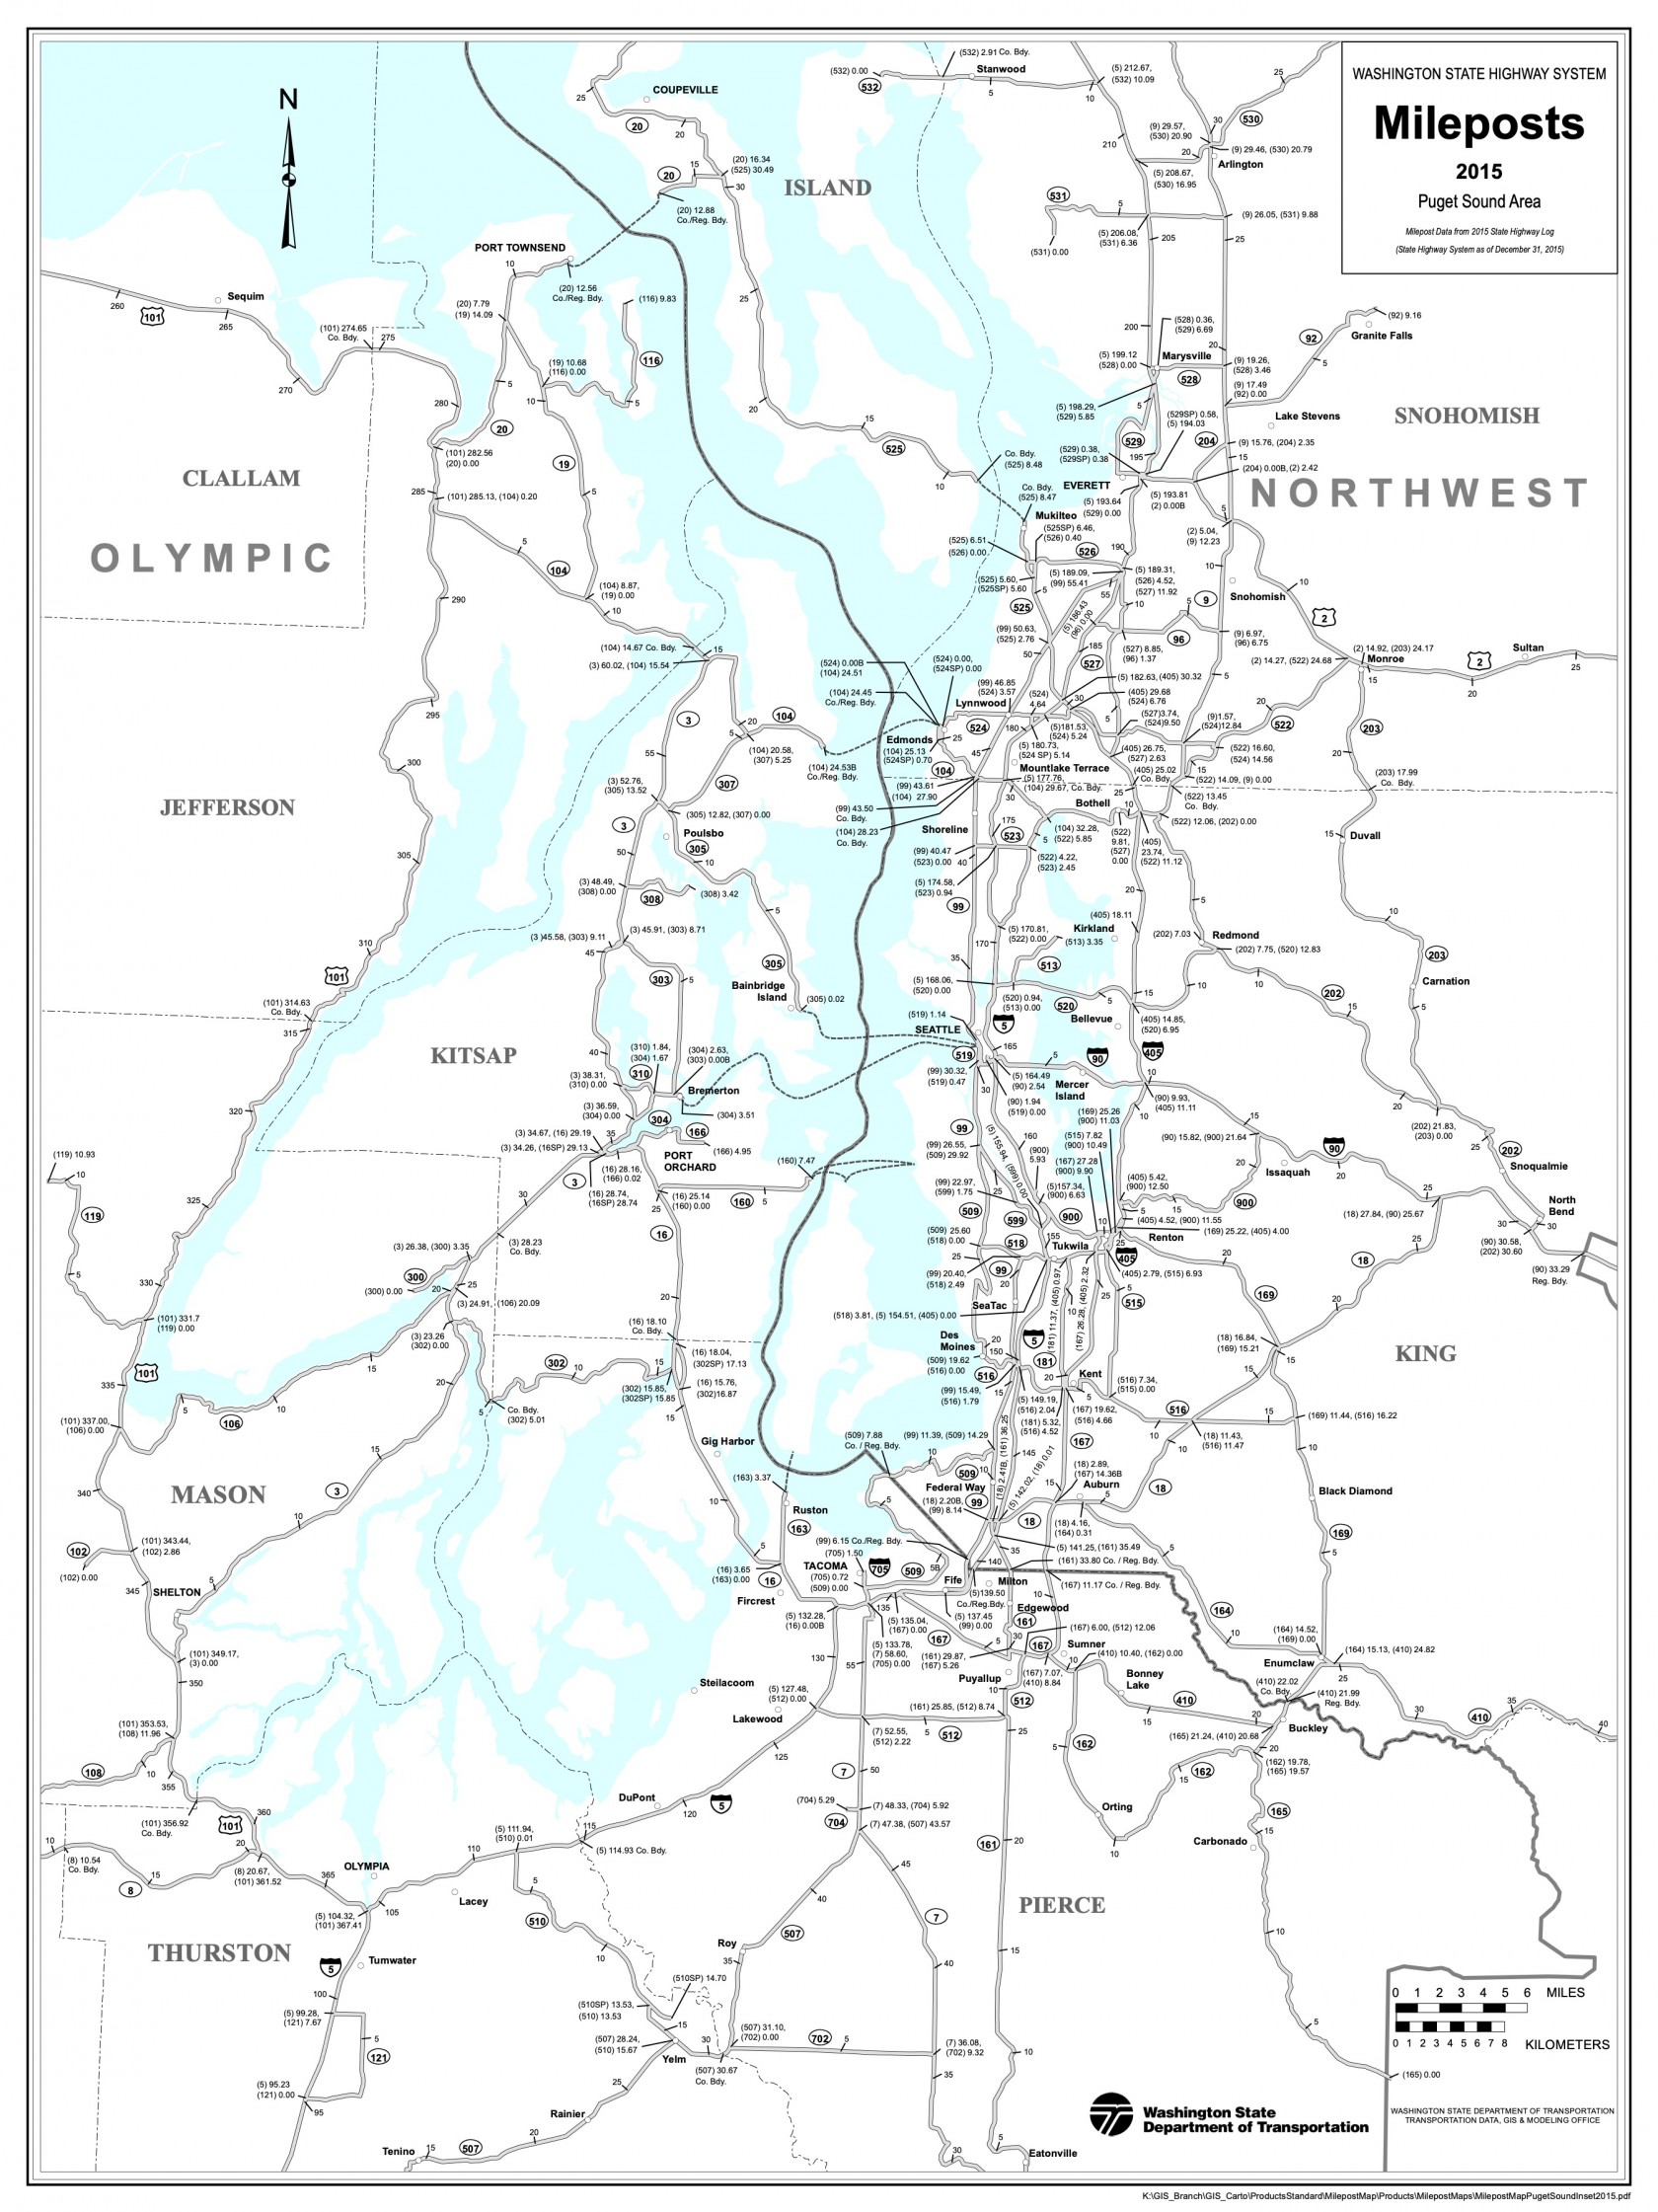
The Governor of the state of Washington has asked for analysis of the effects of allowing self-driving, cooperating cars on the roads listed above in Thurston, Pierce, King, and Snohomish counties. (See the provided map and Excel spreadsheet). In particular, how do the effects change as the percentage of self-driving cars increases from 10% to 50% to 90%? Do equilibria exist? Is there a tipping point where performance changes markedly? Under what conditions, if any, should lanes be dedicated to these cars? Does your analysis of your model suggest any other policy changes?
Your answer should include a model of the effects on traffic flow of the number of lanes, peak and/or average traffic volume, and percentage of vehicles using self-driving, cooperating systems. Your model should address cooperation between self-driving cars as well as the interaction between self- driving and non-self-driving vehicles. Your model should then be applied to the data for the roads of interest, provided in the attached Excel spreadsheet.
Your MCM submission should consist of a 1 page Summary Sheet, a 1-2 page letter to the Governor’s office, and your solution (not to exceed 20 pages) for a maximum of 23 pages. Note: The appendix and references do not count toward the 23 page limit.
Some useful background information:
-
On average, 8% of the daily traffic volume occurs during peak travel hours.
-
The nominal speed limit for all these roads is 60 miles per hour.
-
Mileposts are numbered from south to north, and west to east.
-
Lane widths are the standard 12 feet.
-
Highway 90 is classified as a state route until it intersects Interstate 5.
-
In case of any conflict between the data provided in this problem and any other source, use the
data provided in this problem.
Definitions:
milepost: A marker on the road that measures distance in miles from either the start of the route or a state boundary.
average daily traffic: The average number of cars per day driving on the road.
interstate: A limited access highway, part of a national system.
state route: A state highway that may or may not be limited access.
route ID: The number of the highway.
increasing direction: Northbound for N-S roads, Eastbound for E-W roads.
decreasing direction: Southbound for N-S roads, Westbound for E-W roads.

